
Client
Circuit Zandvoort
Industry
Motorsport and events
Services we provided
• UI / UX
• Development
• Hosting
Technologies
• Laravel
• Vue
• Kubernetes
Do you want to know more?
Linking the track agenda to live sound measurements
A busy neighbour in the dunes
Circuit Zandvoort is the iconic race track in the dunes, and former home of the Dutch Grand Prix. Besides race weekends, the track is rented out almost every day for track days, driving experiences, tests and corporate events. Sound limits for the track are strict, and the circuit has to show at all times that it stays within them.
Bringing planning and measuring together
The track agenda lived in a spreadsheet and the sound data came from a measuring station. Checking compliance meant matching the two by hand. Since 2021, El Niño has built and maintained the Circuit Zandvoort Sound Dashboard, which brings the daily program and the measured sound levels together in one place.
One agenda, straight from the source
The circuit keeps planning in its familiar Excel agenda. The dashboard imports it, maps every booking to a time slot and shows what changed since the last import. Each activity gets a sound class, from "barely noticeable" to "strongly noticeable".
Measurements every five minutes
The dashboard pulls sound levels from the circuit's measuring system every five minutes. After 19:00 it calculates the daytime figures, and after 23:00 the evening figures: the average level and the highest five-minute peak.
Alerts when it matters
When a five-minute peak goes over the sound limit, all administrators get a notification straight away. They review the event and add context. Anything not reviewed within seven days is approved automatically, with a full audit log.
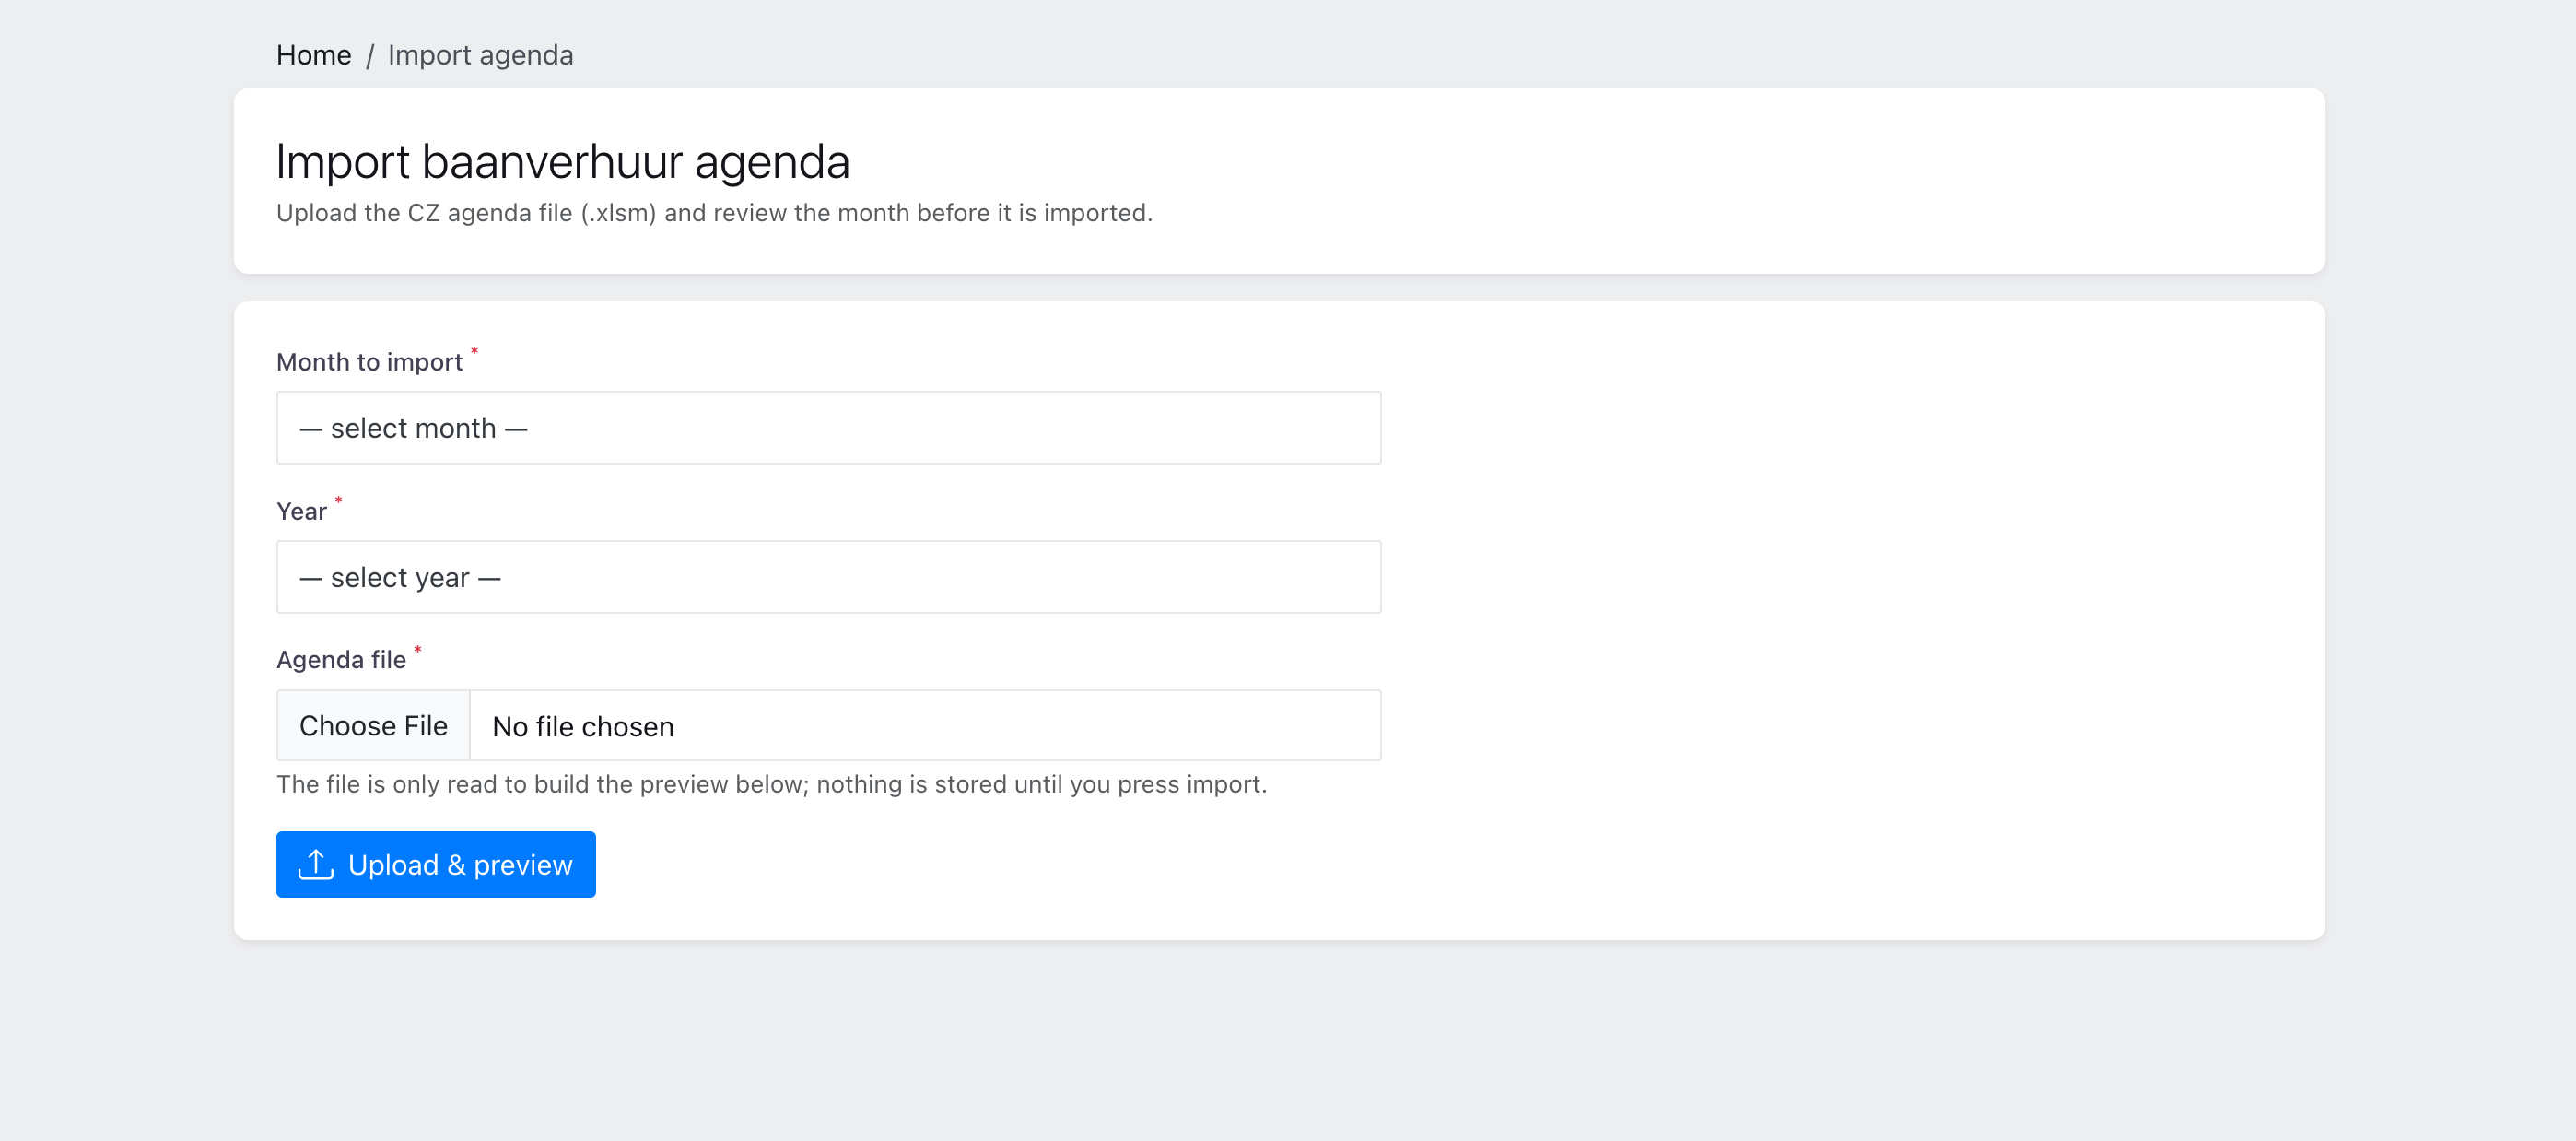
The circuit uploads its familiar Excel agenda and reviews the month before anything is imported.
Built to keep running
Two data sources, one history
When the circuit moved from an FTP setup with one-minute data to a REST API with five-minute data, the dashboard handled both. No history was lost, and old and new days are assessed the same way.
Gaps never go unnoticed
If measurements are missing for a period, our team gets a warning in Slack right away. That way every day on the track can be accounted for.
Hosted and maintained by El Niño
The dashboard runs on our own Kubernetes hosting. We keep it up to date and adapt it when the circuit's agenda or measuring setup changes, so the team can focus on the track.
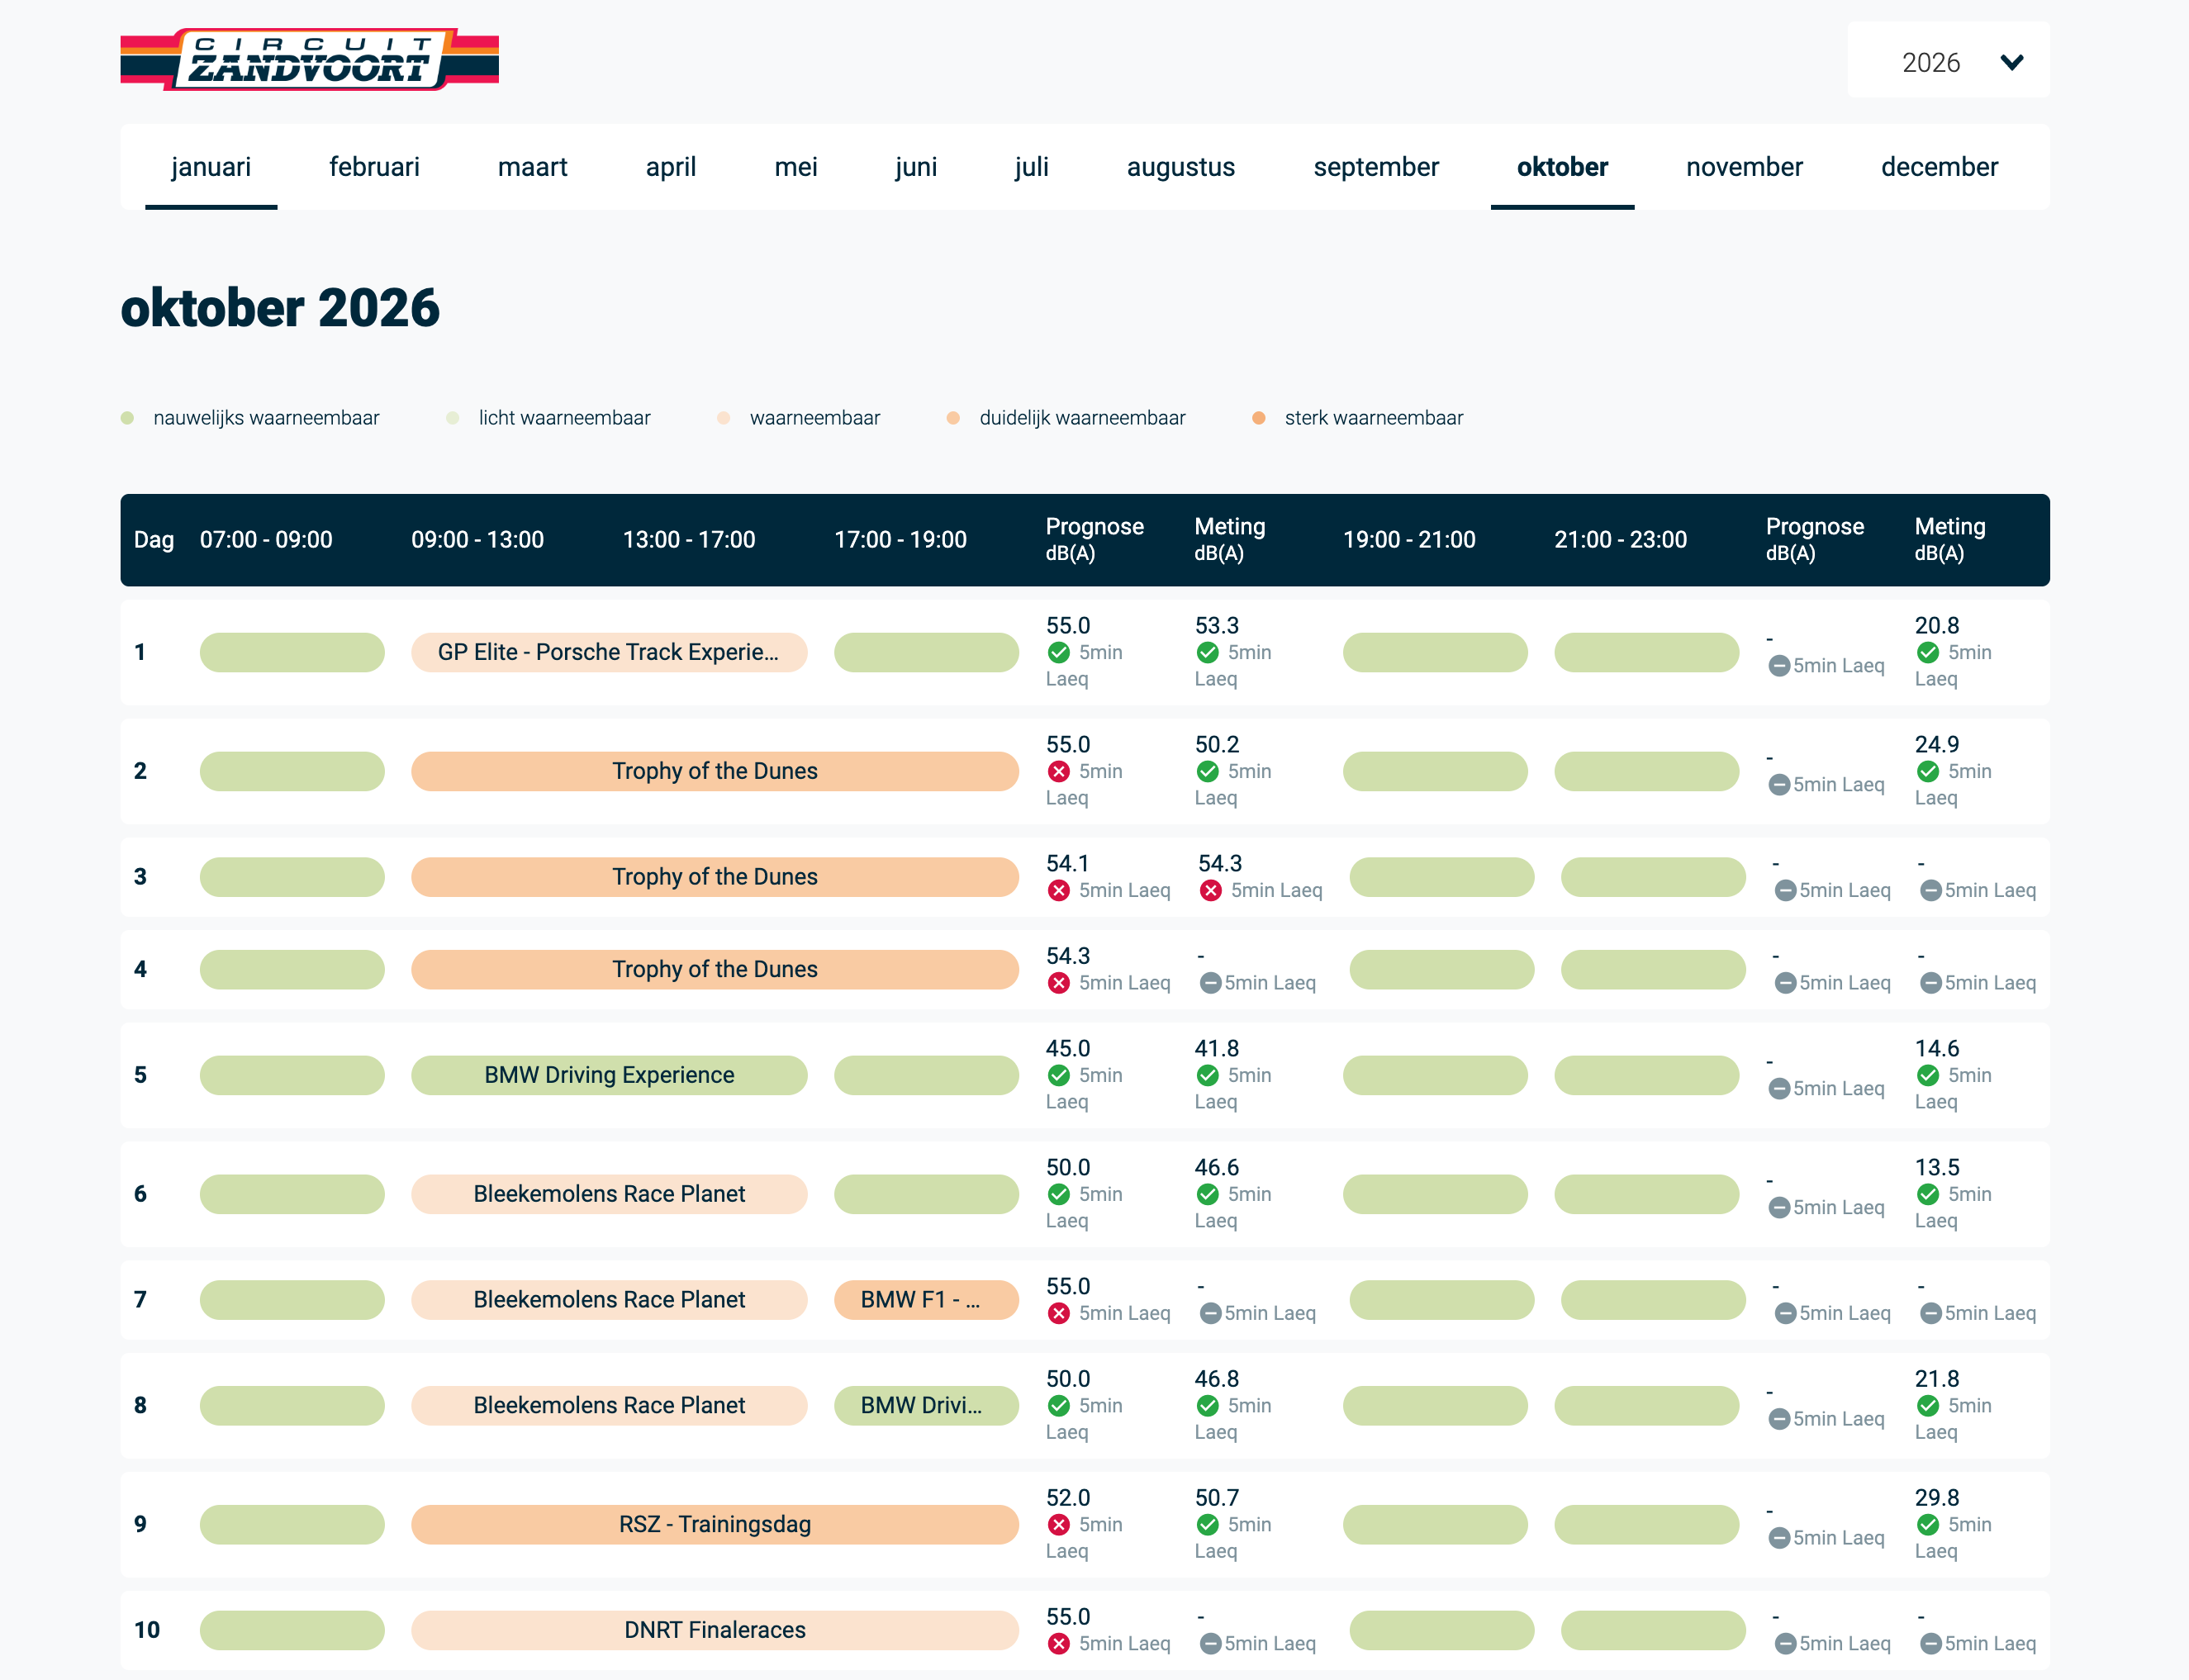
The sound calendar shows every day of the month at a glance, measured against the sound limit.
The result: every activity next to its sound impact
Insight on the same day
The circuit now sees every activity next to its sound impact, on the same day. Exceedances are flagged automatically instead of found by hand. Also open to the public on this page: https://geluid.circuitzandvoort.nl/2026/10
Ready for reporting
Every review is logged, so the circuit can always show what happened on the track and how it was handled.
In numbers
Live since 2021. A measurement every 5 minutes. 2 assessment periods per day: daytime 07:00 to 19:00 and evening 19:00 to 23:00. 5 sound classes per activity.

