
Client
Alliander
Industry
Energy grid operator
Company size
10.000+ employees
Services we provided
• UI / UX
• Development
• Enterprise architecture
Technologies
• Laravel
• Vue
• Highcharts
• Keycloak
• OpenShift
Do you want to know more?
A secure viewer for grid measurements
Keeping an eye on a busy grid
Alliander manages the electricity and gas grid for millions of households and businesses in the Netherlands. With the energy transition, the grid is busier than ever, and engineers need to see what happens on it, fast.
One viewer for all measurement data
The measurement data was there, spread over source systems like SCADA, but finding the right signal was slow and technical. El Niño built the Alliander Visualiser: one viewer any engineer can use, running inside Alliander's own secure environment.
Find any measurement in seconds
Every night, the viewer imports the full catalogue of measurement points. Engineers search by city, station, installation or component, for both electricity and gas.
Graphs that do the maths
Engineers combine signals in one graph, zoom in on any period and add calculations, like apparent power. Graphs can be saved, shared with colleagues and exported to CSV or PDF.
Secure by design
Users log in with Alliander's own single sign-on. Every request, and every call to Alliander's data APIs, is written to an audit trail that is kept for 90 days.
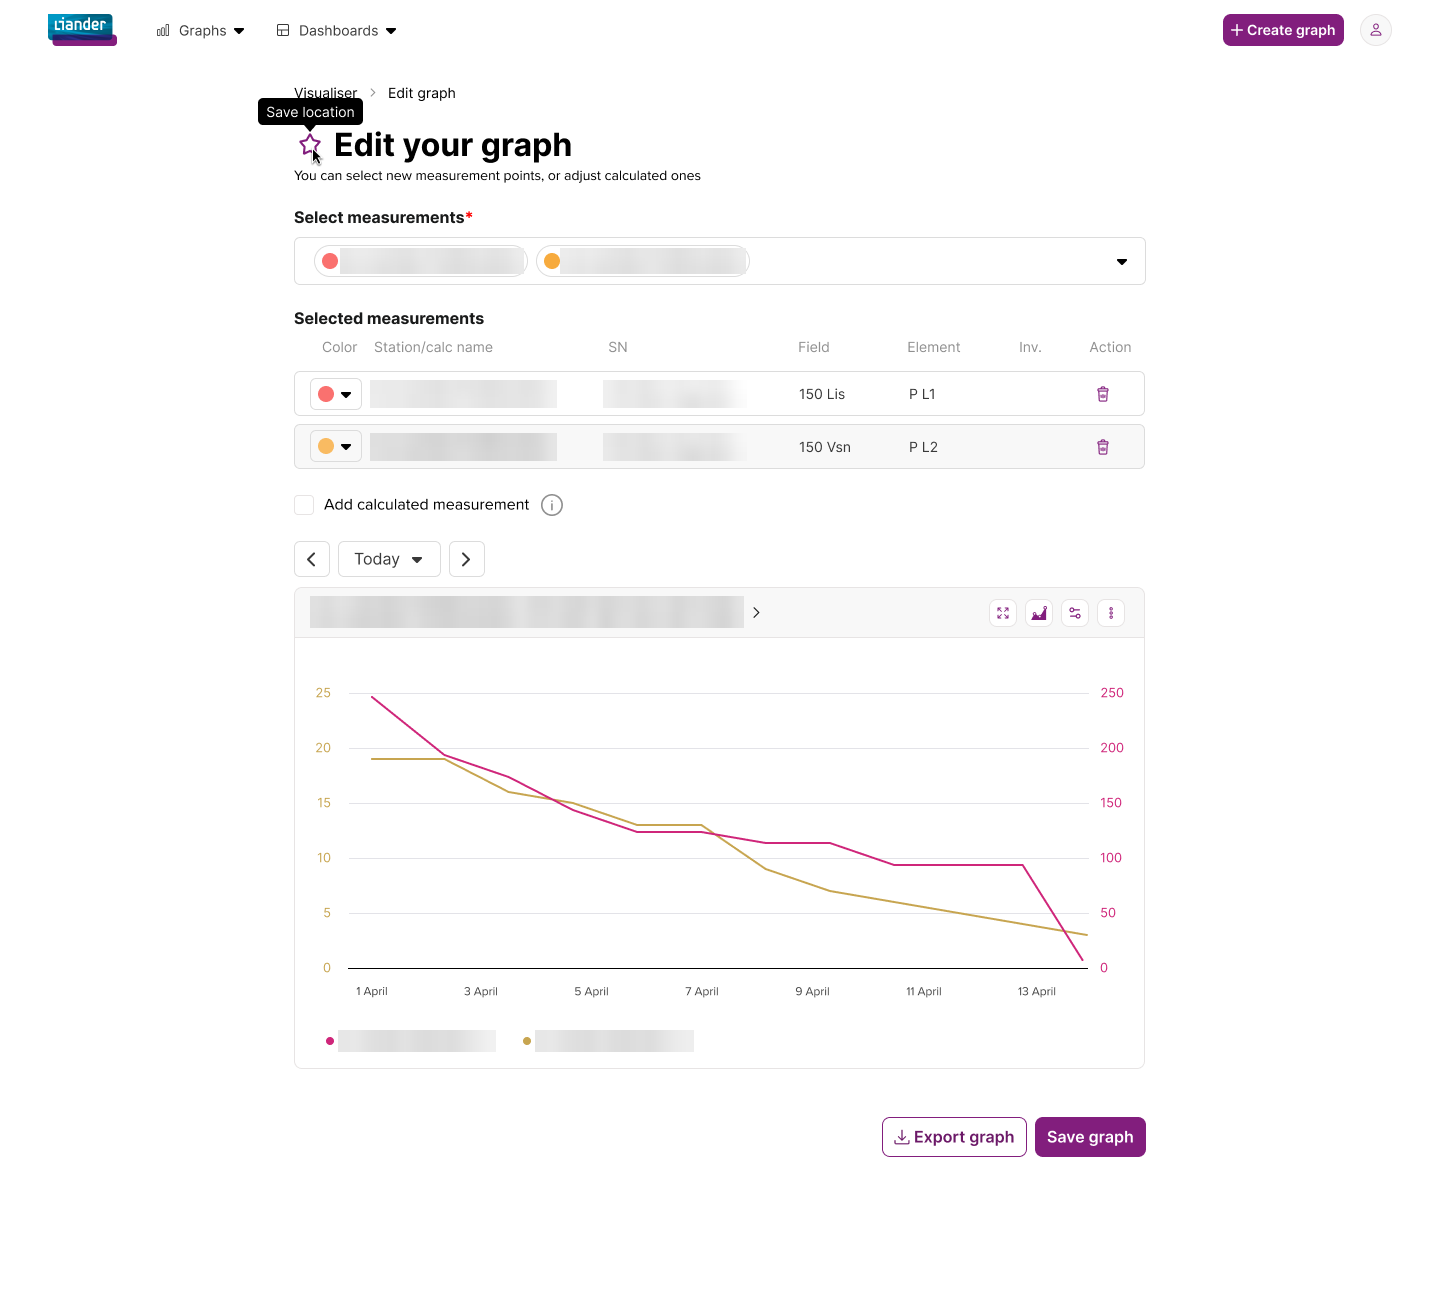
Engineers combine measurements from any station in one graph, then save it or export the data.
Running where the data lives
Inside Alliander's own platform
The viewer is deployed on Alliander's own container platform, close to the data it shows. Measurement values are fetched live when a graph is opened and are never stored by the viewer.
Tested before every release
We load tested the viewer before go-live, and automated end-to-end tests cover the key user flows. We perform in-depth user reviews before every release to make sure that the UI of the tool stays intuitive and logical to their daily work.
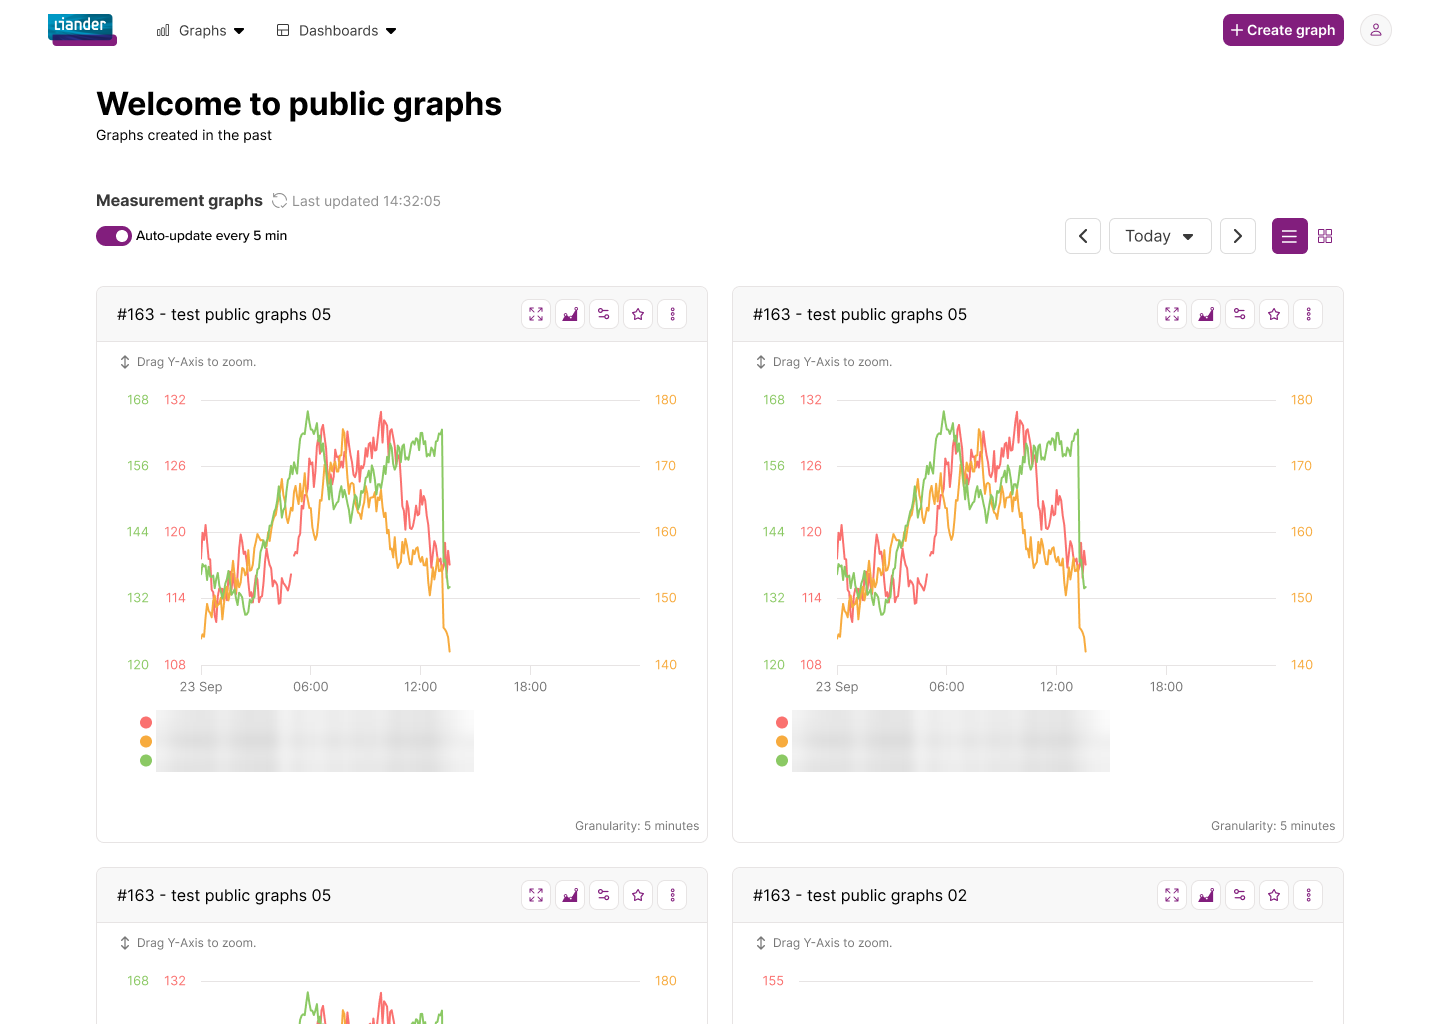
Public graphs share live measurements with the wider team and refresh automatically every five minutes.
Low-voltage data and fraud detection
Low-voltage measurements on board
Since mid-2026 the viewer also imports Alliander's low-voltage measurements, next to the medium and high-voltage data from SCADA. Engineers now see the grid from substation down to the low-voltage network in one place.
Built with the fraud team
Alliander's fraud specialists use the viewer to spot unusual energy patterns. For example, weekends can be highlighted in any graph, so a pattern that stays flat all week stands out at once.
Ready-made dashboards
We are bringing Alliander's standard low-voltage dashboards into the viewer as ready-made templates: phase statistics, harmonic analysis and a dedicated dashboard for the fraud team. Each user only sees the measurement domains their role allows.
The result
Engineers and fraud analysts find and compare grid measurements themselves, without writing a single query, inside Alliander's own secure environment.

